Somerset Levels: Map key
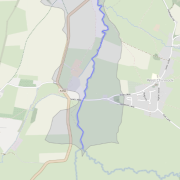
River and catchment area
The blue line is the course of the river. Only river sections where river level data is available are plotted on the map.
The grey area surrounding the river it its associated catchment.
Tapping on the catchment area brings up the water body identity with a link to the Environment Agency ecological data.
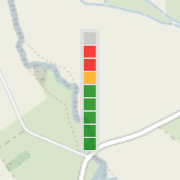
River level gauge
The base of the gauge shows the location of an Environment Agency monitoring station and the ladder indicates the current relative water height.
If the gauge goes orange, the river is over its normal height range.
If the gauge shows 3 reds, it is very close to setting a new recent record height.
Tapping on the gauge brings up more information, a link to the Environment Agency station page and, if available, a webcam link.
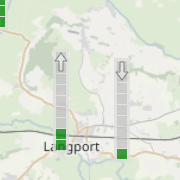
River level change indicator
At the top of each river level gauge may be shown an arrow to indicate the direction of recent level change. If there is no arrow, the level has been steady recently.
- River level recently rising
- River level recently falling
Tapping on the gauge brings up more information, including the rate of level change.
The rate of change is based on the latest 5 received level readings, spanning 75 minutes, and is calculated using the least squares method; this may not match the Environment Agency, I have yet to find out how they calculate.
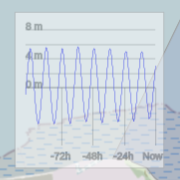
Tidal level gauge
Shows the location of an Environment Agency monitoring station & a graph of the tidal water level from 4 days ago to the current time.
Tapping on the gauge brings up more information & a link to the Environment Agency station page.
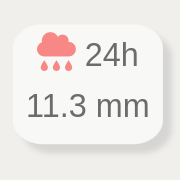
Rainfall gauge
Shows the rough location of an Environment Agency monitoring station & the last 24 hours' rainfall measurement.
The colour of the cloud icon indicates the rainfall measurement over the last hour:
- Less than 2 mm
- Between 2 and 4 mm
- Between 4 and 8 mm
- More than 8mm
Tapping on the gauge brings up more information, last 1 hour and 6 hour rainfall measurements & a link to the Environment Agency station page.
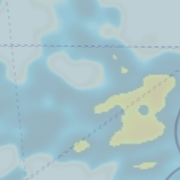
Rain/precipitation radar
A semi-transparent layer showing the latest precipitation detected by radar.
Precipitation radar is only available at certain map zoom levels, and there may be none to see.
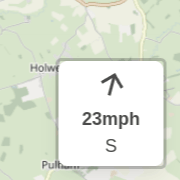
Wind indicator
The wind indicator shows the current wind at an altitude of 120 metres over Westonzoyland Airfield, 51.1°N, 2.9°W. The arrow points where the wind is going.
The indicator augments the Rain radar, giving a rough guide to where the rain is likely to travel in the next hour or so, avoiding the need to add animations to the map. The indicator updates every 10 minutes or so.
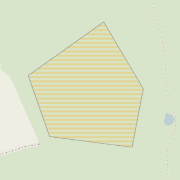
Flood alert
"Flooding is possible, be prepared" is the Environment Agency definition of any area enclosed in horizontal yellow hatching.
Tapping on the hatched area brings up more information about the alert.
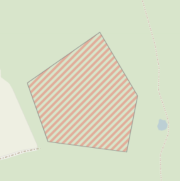
Flood warning
"Flooding is expected, immediate action required" is the Environment Agency definition of any area enclosed in 45° red hatching.
Tapping on the hatched area brings up more information about the warning.
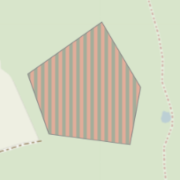
Severe flood warning
"Severe flooding, danger to life" is the Environment Agency definition of any area enclosed in vertical red & black hatching.
Tapping on the hatched area brings up more information about the warning.
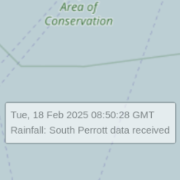
Data ticker
The data ticker updates whenever the map receives and displays fresh data.
© somersetlevels.uk 2026